


Introduction
Non-small cell lung cancer (NSCLC) is one of the leading causes of cancer- related mortality worldwide, accounting for approximately 85% of all lung cancer cases. Despite significant advances in treatment, particularly through the implementation of immune checkpoint inhibitors (ICI), the prognosis for patients with metastatic NSCLC remains poor. The response to ICI is variable, and only a subset of patients derive substantial benefit, highlighting the urgent need to identify new prognostic biomarkers to optimize therapy and improve survival outcomes [1, 2].
Recently, there has been growing interest in exploring body composition as a potential source of prognostic information. Specifically, the radiologic density of subcutaneous adipose tissue (SAT), assessed via computed tomography, has garnered increasing attention. Elevated SAT density may indicate reduced lipid content, fibrosis, or the “browning” of adipose tissue – features commonly associated with cachexia, a syndrome frequently linked to tumour progression and poor prognosis [3].
A study by Sun et al. [4] demonstrated that in NSCLC patients, higher radiologic SAT density is associated with increased tumour metabolic activity and reduced overall survival. Notably, patients with high SAT density had a median survival of 45.3 months compared to 50.5 months in the low-density group (p = 0.026). The authors suggested that tumours with high metabolic activity may induce changes in SAT, such as increased fibrosis and reduced lipid density.
Other studies have also emphasized the importance of radiological body composition assessment in predicting immunotherapy outcomes in NSCLC. For instance, a systematic review by Pei et al. [5] found that in three out of six studies, a greater amount of adipose tissue positively correlated with treatment response and survival in NSCLC patients receiving ICI. The prognostic value of SAT and visceral adipose tissue (VAT) varied, suggesting that not only the quantity but also the quality of adipose tissue may influence the efficacy of immunotherapy [6].
The prognostic significance of SAT remains unclear in patients with metastatic NSCLC receiving ICI therapy. In a retrospective study by Popinat et al. [7], which included 55 patients with metastatic NSCLC treated with nivolumab, a reduction in SAT volume as measured by radiologic imaging was identified as a predictor of poor overall survival. Conversely, a similar study involving 44 patients with metastatic NSCLC treated with pembrolizumab found that a decrease in SAT during immunotherapy had no statistically significant impact on survival. The authors suggested that SAT alone may not represent an independent prognostic factor in this context [8]. The apparent discrepancy in outcomes between patients treated with nivolumab and pembrolizumab may stem from differences in line of therapy and baseline patient characteristics. In the study by Popinat et al. [7], nivolumab was administered as a second- or later-line treatment, often following platinum-based chemotherapy. In contrast, Baldessari et al. [8] evaluated patients receiving first-line pembrolizumab, who typically exhibit better performance status and preserved metabolic reserve. Such differences may influence the prognostic value of adipose tissue parameters, inclu- ding SAT. Moreover, variations in sample size, study design, and timing of body composition assessments could also contribute to the divergent findings.
Given the above, radiologic assessment of SAT may emerge as a promising tool for risk stratification and outcome prediction in patients with metastatic NSCLC [9]. It is worth noting that most existing studies have focused on the amount and distribution of adipose tissue and on evaluating the SAT-to-VAT ratio. However, studies specifically assessing the role of SAT radiodensity in predicting ICI efficacy in metastatic NSCLC are very limited. In fact, only the study by Chaunzwa et al. [10] reported that an increase of more than 5% in SAT density during immunotherapy was associated with poorer overall survival in NSCLC patients, particularly among women. To our knowledge, no prior study in Ukraine or Eastern Europe has systematically examined SAT radiodensity in this patient population. In light of these encouraging preliminary findings, further research is required to confirm or refute these observations and to elucidate the relationship between SAT density and response to ICI therapy. Because SAT radiodensity can be extracted from routine computed tomography (CT) scans without additional cost, it may offer a scalable biomarker in diverse clinical settings.
It is important to distinguish between SAT volume and radiodensity. While SAT volume refers to the total mass or thickness of subcutaneous fat, typically measured in cubic centimetres or cross-sectional area, radiodensity reflects the tissue composition – specifically, its lipid content, fibrosis, and inflammatory status. Radiodensity is expressed in Hounsfield units (HU) and provides qualitative information that cannot be inferred from volume alone. For example, two patients may have similar SAT volume but markedly different radiodensity values, suggesting distinct metabolic and immunologic microenvironments (Supplementary Figure S1).
Given these considerations, we sought to evaluate the prognostic value of SAT radiodensity in patients with metastatic NSCLC receiving ICI therapy.
Material and methods
Study population
A retrospective cohort study was conducted, including 92 patients with metastatic NSCLC who received ICI therapy between 2016 and 2024 at the Sumy Regional Clinical Oncology Center.
Inclusion criteria were: confirmed diagnosis of NSCLC stage IV, administration of at least one dose of ICI therapy (pembrolizumab or atezolizumab), age ≥ 18 years, and availability of high-quality, contrast-enhanced CT scans obtained no more than one month prior to initiation of ICI therapy. Exclusion criteria included: diagnosis of small cell lung cancer, NSCLC stages I–III, absence of ICI therapy, incomplete clinical data, low-quality CT scans, or death from causes unrelated to NSCLC.
Clinical and pathological characteristics were extracted from medical records and included age at the time of CT scan, sex, histological tumour type, smoking status, programmed death ligand 1 (PD-L1) expression, and immunotherapeutic regimen (ICI monotherapy or chemoimmunotherapy). The Charlson comorbidity index (CCI) was calculated for each patient based on documented comorbidities, excluding NSCLC, and adjusted for age [11]. Body mass index (BMI) was calculated using pre-treatment height and weight and classified as underweight (< 18.5), normal (18.5–24.9), overweight (25.0–29.9), or obese (≥ 30.0 kg/m2).
Assessment of subcutaneous adipose tissue radiodensity
Computed tomography scan quality and SAT radioden- sity were assessed by a radiologist blinded to patients’ clinical data and outcomes. Only scans performed within one month prior to ICI initiation were analysed. Subcutaneous adipose tissue was identified using tissue-specific segmentation, with a HU threshold range of –190 to –30. A single axial image at the level of the third lumbar vertebra (L3) was selected for analysis. Mean SAT density (in HU) was calculated within a standardized 1 cm2 area using Syngo.via Siemens Healthineers (version VB6OS-HF01) software. Subcutaneous adipose tissue radiodensity was assessed both as a continuous variable and as categorical variables divided into quartiles (Q1: –120 HU > Q1 ≤ –105 HU; Q2: –106 HU > Q2 ≤ –100 HU; Q3: –99 HU > Q3 ≤ –92 HU; Q4: –91 HU > Q4 ≤ –30 HU) [12]. The quartile thresholds were determined empirically from the SAT radiodensity value distribution in our study cohort by applying an interquartile rank/range-based partitioning approach. Owing to the skewed nature of these values in our sample, the resulting HU intervals differed in width between quartiles. Employing quartiles specific to the study dataset is consistent with recognized standards in body composition research and facilitates relative stratification that reflects the dataset’s inherent characteristics. While these cutoffs allow for relative stratification within the study cohort, they were not based on predefined biological thresholds, and their applicability to other populations remains to be validated.
Outcome assessment
The primary outcome was NSCLC-specific mortality. Death data were obtained from the cancer registry at the Sumy Regional Clinical Oncology Center. Non-small cell lung cancer-specific overall survival was defined as the interval between the first ICI dose and death due to metastatic NSCLC progression. The data collection cut-off date was 1 April 2025.
Statistical analysis
Patient characteristics by SAT density quartiles were compared using Pearson’s χ2 or Fisher’s exact tests for categorical variables. Kaplan-Meier survival curves were generated to visualize differences in survival across SAT quartiles, and log-rank tests were used to assess statistical significance. Hazard ratios (HR) and 95% CI were calculated using Cox proportional hazards regression models to estimate the association between SAT density and NSCLC-specific mortality. Model 1 was unadjusted. Model 2 was adjusted for age, sex, histological type, smoking status, PD-L1 expression, immunotherapy regimen, and CCI. Model 3 was additionally adjusted for BMI.
The proportional hazards assumption was tested using Schoenfeld residuals. To assess nonlinear associations between SAT density and NSCLC-specific mortality risk, restricted cubic spline analysis (3 knots) was performed. The likelihood ratio test compared linear and spline models. Restricted cubic spline models were fitted using three knots placed at the 10th, 50th, and 90th percentiles of SAT radiodensity, with the median value set as the reference point. Knot locations were selected based on standard recommendations for moderate sample sizes. Internal validation of the Cox models was performed using nonparametric bootstrap resampling with 1,000 iterations to assess the robustness of HR estimates. Sensitivity analyses using alternative knot placements were not conducted in the present study. Subgroup and interaction analyses between SAT density and clinicopathological factors were performed to identify predictors of survival. Subgroups were defined a priori based on biological plausibility and existing literature. Bonferroni correction was applied for multiple comparisons to control for type I error. All analyses were performed using Stata version 19.5 (StataCorp, Texas, USA; https://www.stata.com, 2025). A p-value < 0.05 was considered statistically significant.
Results
Patient characteristics
The median age of the study cohort was 61.0 years (interquartile range: 57.0–67.0). All 92 patients were stratified into four equal quartiles (n = 23 each) based on SAT radiodensity values. Baseline clinical and molecular characteristics across SAT radiodensity quartiles (Q1–Q4) are summarized in Table 1.
Table 1
Patient characteristics by quartiles of subcutaneous adipose tissue radiodensity
Male patients predominated across all quartiles, ranging from 78.3% in Q1 to 91.3% in Q4, with no statistically significant difference (p = 0.768). Age distribution was also similar: the proportion of patients aged ≥ 60 years increased gradually from 43.5% in Q1 to 69.6% in Q4 (p = 0.831).
Tumour histology (p = 0.395), smoking status (p = 0.176), and PD-L1 expression (p = 0.710) showed no significant differences across quartiles. However, the highest SAT density quartile (Q4) had a predominance of smokers (91.3%), suggesting a potential non-significant association. The immunotherapy regimen (ICI monotherapy vs. chemoimmunotherapy) was not significantly associated with SAT density (p = 0.492).
Charlson comorbidity index was similar across quartiles (p = 0.786), with CCI = 2 being the most prevalent category (43.5–56.5%). Body mass index, in contrast, demonstrated a statistically significant association with SAT radiodensity (p = 0.007). In Q1 (lowest SAT density), no patients were underweight; overweight (43.5%) and obese (26.1%) individuals predominated. In Q4 (highest SAT density), 21.7% were underweight and only 4.4% were obese. This inverse association between SAT density and BMI may reflect greater metabolic decompensation or cachexia in patients with higher SAT radiodensity.
Radiologic subcutaneous adipose tissue density and survival analysis
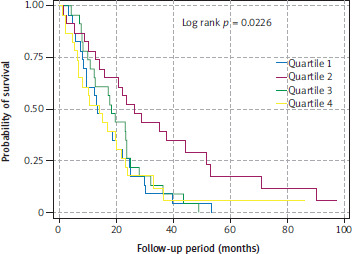
The best overall survival was observed in patients in the second quartile, characterized by intermediate SAT radiodensity. The median overall survival for patients in quartiles Q1, Q2, Q3, and Q4 was 13.4, 26.3, 18.4, and 14.2 months, respectively (log-rank p = 0.0226) (Figure 1).
Figure 1
Overall survival of metastatic non-small cell lung cancer patients stratified by quartiles of subcutaneous adipose tissue radiodensity
We next assessed the association between SAT radiodensity and overall mortality using Cox proportional hazards regression models. Patients were stratified by SAT density quartiles, with Q1 (lowest density) serving as the reference category. Three models were constructed with stepwise adjustment for covariates. In all three models, Q2 (second- lowest SAT density) was significantly associated with a lower risk of overall mortality compared to the reference group: Model 1 (HR = 0.42; 95% CI: 0.22–0.78; p = 0.007), Model 2 (HR = 0.32; 95% CI: 0.15–0.64; p = 0.002), Model 3 (HR = 0.32; 95% CI: 0.15–0.64; p = 0.002).
These findings suggest a significantly reduced mortality risk in patients with moderately decreased SAT density compared to those with the lowest levels. This effect was consistent across all three analytical models, regardless of covariate adjustment levels.
The lowest mortality risk was observed in Q2, followed by a reversion toward the reference level in Q3 and Q4. This indicates a potential nonlinear or U-shaped association between SAT density and mortality in NSCLC patients. Such a U-shaped relationship may reflect an optimal metabolic balance in patients with moderate SAT density, whereas both excessively low and high densities may be linked to cachexia or resistance to therapy. This hypothesis was further explored using a restricted cubic spline model, which confirmed a statistically significant nonlinear relationship and demonstrated the absence of a simple linear trend.
The p-values for trend across the three models were 0.481, 0.523, and 0.712, respectively – none of which reached statistical significance, indicating a lack of a linear trend in mortality risk across SAT density quartiles. In other words, increasing SAT radiodensity was not associated with a progressive decrease in mortality risk (Table 2).
Table 2
Cox regression analysis of the association between subcutaneous adipose tissue radiodensity and non-small cell lung cancer- specific mortality
[i] HR – hazard ratio, SAT – subcutaneous adipose tissue
Model 1 was unadjusted.
Model 2 was adjusted for age, sex, histology, smoking status, programmed death ligand receptor expression, immunotherapy regimen, and Charlson comorbidity index.
Model 3 was adjusted for all covariates of Model 2 + body mass index.
Bootstrap resampling with 1,000 iterations yielded HR estimates consistent with the primary analysis. In particular, Q2 remained significantly associated with reduced mortality compared to Q1 (HR = 0.32, 95% CI: 0.13–0.79, p = 0.013), supporting the robustness of our findings (Supplementary Table S1).
Subcutaneous adipose tissue radiodensity, analysed as a continuous variable, did not demonstrate a statistically significant association with the risk of death in any of the three models (Model 1: HR = 1.00, 95% CI: 0.99–1.01, p = 0.828; Model 2: HR = 1.00, 95% CI: 0.98–1.01, p = 0.911; Model 3: HR = 0.99, 95% CI: 0.98–1.01, p = 0.738). This finding indicates that the approach based on the distribution of SAT radiodensity by quartiles is more informative.
Restricted cubic spline analysis
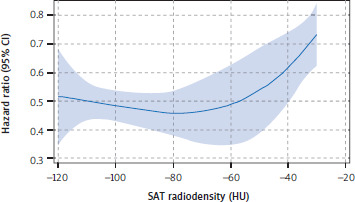
To visualize the relationship between SAT radiodensity and HR in patients with metastatic NSCLC, a restricted cubic spline plot was generated. The splines were derived from HR estimated using Model 3, which was adjusted for age, sex, histological type, smoking status, PD-L1 expression, immunotherapy regimen, CCI, and BMI.
To assess whether the full model offered a better fit than a simpler linear model, we performed a likelihood ratio (LR) test. The test indicated that the full spline-based model explained a significantly greater amount of variation in the data compared to the linear model: LR χ2 = 21.84, p = 0.0094 (Figure 2).
Figure 2
Restricted cubic spline curve showing the nonlinear association between subcutaneous adipose tissue radiodensity and nonsmall cell lung cancer-specific mortality
HU – Hounsfield units, SAT – subcutaneous adipose tissue The solid blue line represents the hazard ratio; the shaded area around the line indicates the 95% confidence interval.
Subgroup analysis
Subgroup analysis revealed that most clinical parameters – including sex, age, tumour histology, smoking status, immunotherapy regimen, CCI, and BMI – were not significantly associated with mortality risk (all p > 0.05). The only variable with a statistically significant effect was PD-L1 expression. Patients with PD-L1 levels of 1–49% had a significantly higher risk of death (HR = 2.793; 95% CI: 1.608–4.850; p < 0.0001). In contrast, patients with PD-L1 ≥ 50% showed a protective effect (HR = 0.350; 95% CI: 0.201–0.609; p < 0.0001)
To better understand the role of SAT, interaction models were constructed to assess the relationship between SAT radiodensity and various clinicopathological characteristics. Among all interactions tested, only the interaction between PD-L1 expression and SAT radiodensity reached statistical significance (HR = 1.010; 95% CI: 1.005–1.016; p < 0.0001). This finding suggests that SAT radiodensity may modulate the prognostic effect of PD-L1 expression on survival outcomes. Other interaction terms involving SAT radiodensity – including age, sex, immunotherapy regimen, CCI, and BMI – did not demonstrate statistical significance (Table 3).
Table 3
Subgroup analysis examining the association between subcutaneous adipose tissue radiodensity and non-small cell lung cancer-specific mortality across clinical parameters
In stratified Kaplan-Meier analyses by PD-L1 expression, survival did not differ significantly across SAT quartiles in patients with PD-L1 expression of 1–49% (log-rank p = 0.2664). Nevertheless, patients in Q2 again demonstrated the most favourable survival trend, suggesting that the lack of statistical significance may be attributable to limited sample size and reduced statistical power (Supplementary Figure S2). In contrast, in patients with PD-L1 ≥ 50%, SAT radiodensity was significantly associated with overall survival (log-rank p = 0.0214), with the best outcomes observed in Q2 (Supplementary Figure S3). These findings were consistent in multivariable Cox regression models stratified by PD-L1 status, as shown in Supplementary Table S1, where Q2 was associated with the strongest reduction in mortality risk (HR = 0.024, 95% CI: 0.001–0.291, p = 0.003).
To control the risk of false positives in subgroup analyses, a Bonferroni correction (α = 0.00625) was used. Only the interaction between SAT radiodensity and PD-L1 expression remained statistically significant after adjustment.
Discussion
In this study, we found that patients with metastatic NSCLC receiving ICI therapy had the best overall survival when SAT radiodensity was in the moderate range (Q2), whereas both lower and higher values were associated with less favourable outcomes. This pattern may reflect the operation of different pathological mechanisms at opposite extremes of SAT quality. At the high end (Q4), very elevated radiodensity likely corresponds to advanced tissue remodelling with loss of lipid content, fibrosis, browning, and inflammatory macrophage infiltration – hallmarks of late-stage cancer-associated cachexia driven by cytokines such as interleukin 6 (IL-6) [13–15]. These features may impair metabolic reserve and immune competence, leading to poorer outcomes. In contrast, Q3 – with moderately elevated radiodensity – may not yet reach this pathological threshold, which could explain the absence of a significant survival disadvantage despite the upward shift in density. At the low end (Q1), lipid-rich SAT may indicate excessive energy storage, reduced metabolic flexibility, and chronic low-grade inflammation, with altered adipokine signalling (e.g., leptin-STAT3-PD-1 axis) promoting T-cell exhaustion [16–19]. Thus, Q2 may represent an “immunometabolic optimum,” combining adequate energy reserves with minimal remodelling, which supports both treatment tolerance and effective antitumor immunity.
In the context of this study, the term “immunometabolic optimum” is defined pragmatically as the SAT radiodensity range corresponding to Q2, which was associated with the most favourable survival outcomes. This interpretation is supported by Figure 1, where Q2 patients demonstrated the best overall survival, and by Figure 2, where restricted cubic spline analysis revealed a nadir of HR within the same radiodensity interval. Enrichment of PD-L1 ≥ 50% in Q2 could further enhance the apparent benefit in this quartile, underscoring the potential interaction between host metabolic status and tumour-intrinsic predictors [1, 5, 6].
Stratified analyses by PD-L1 expression further reinforced this interpretation. In both PD-L1 subgroups, patients with intermediate SAT radiodensity (Q2) consistently showed the most favourable outcomes. While the survival difference was not statistically significant in the PD-L1 1–49% subgroup, likely due to limited statistical power, the same trend was evident. By contrast, in tumours with high PD-L1 expression, the prognostic effect of SAT radiodensity became more pronounced, with Q2 clearly emerging as the optimal group. Taken together, these observations suggest that the prognostic role of SAT radiodensity may be particularly relevant in the context of strong tumour immunogenicity, yet the consistent advantage of Q2 across both strata supports the broader concept of an immunometabolic optimum.
Our restricted cubic spline analysis supported a mild U-shaped trend between SAT radiodensity and mortality, but the evidence for strong non-linearity was limited. Only Q2 demonstrated a statistically significant survival advantage; Q3 and Q4 did not reach significance and retained HR below 1. Ideally, a robust U-shaped pattern would show a HR above 1 at higher radiodensity levels, which was not observed. In addition, Kaplan-Meier curves suggested that Q3 outcomes were closer to Q1 and Q4, rather than fitting an idealized U-shape. These discrepancies may result from the relatively small sample size in each group, the wide confidence intervals across much of the SAT range, and the use of quartile-based cutoffs that may not perfectly represent the continuous nature of the relationship. Alternative cutoffs and more flexible spline models could help confirm whether this pattern is genuine or a statistical artifact [20].
Although quartile-based stratification lacks predefined biological thresholds, it was selected a priori to explore internal survival patterns and identify potential non-linear associations. To address this limitation, we also assessed SAT radiodensity as a continuous variable using multivariable Cox regression and restricted cubic spline analysis. These models did not demonstrate a significant linear trend, but supported a mild U-shaped relationship, reinforcing the validity of the quartile-based approach in capturing clinically relevant survival differences within this cohort.
Beyond its role as an energy reservoir, adipose tissue is increasingly recognized as an active endocrine and immunomodulatory organ. Through the secretion of adipokines, cytokines, and metabolites, it shapes systemic metabolism, inflammatory tone, and immune surveillance. In cancer, these functions are particularly relevant, as both quantitative (volume) and qualitative (radiodensity) features of adipose tissue may influence tumour progression and treatment response. Adipose tissue produces pro-inflammatory mediators such as tumor necrosis factor (TNF)-α, leptin, and IL-6 [16], which modulate various aspects of immune homeostasis. Leptin, for example, contributes to CD8+ T-cell dysfunction by upregulating PD-1 expression via STAT3 signalling [18]. Increased PD-1 expression promotes T-cell exhaustion, but this exhaust state renders T-cells more responsive to ICI therapy, as they are direct targets of checkpoint blockade [17, 19]. Importantly, the overall impact of adipose tissue is context-dependent: while extreme states of low or high SAT radiodensity are associated with immunosuppression, an intermediate range (Q2) may represent an immunometabolic optimum, characterized by a more favourable balance between pro- and anti-inflammatory signals (Supplementary Figure S4).
The qualitative properties of adipose tissue as predictors of therapeutic efficacy are attracting growing attention. The prognostic value of SAT radiodensity has been investigated in colorectal [21], breast [22], and bladder cancers [23], yet data on metastatic NSCLC remain scarce. We tried to clarify general trends within this limited evidence base.
Our results align with those of Kapoor et al. [24], who reported that increased SAT radiodensity in cancer patients correlated with reduced survival in NSCLC. Similarly, Zhang et al. [25] found that patients with hepatocellular carcinoma and high SAT density experienced poorer responses to ICI therapy, regardless of BMI or total adipose volume. Notably, tissue quality (i.e., density), not quantity, better predicted clinical outcomes.
In contrast, some findings differ from a study [26] that associated larger SAT volume with better ICI treatment outcomes, such as prolonged progression-free survival, overall survival, and improved disease control. However, that analysis did not consider adipose density, highlighting a possible discrepancy between quantitative and qualitative adipose characteristics that warrants further exploration. Makrakis et al. [27] investigated the impact of adipose tissue on ICI efficacy in metastatic NSCLC by converting SAT density into a specific index normalized for body surface area. A low SAT index was associated with reduced overall survival.
The reduced mortality risk observed in our study for the second quartile of SAT radiodensity remained significant after adjusting for key clinicopathologic covariates, including BMI. This finding supports the hypothesis that SAT radiodensity may serve as an independent prognostic biomarker in NSCLC patients undergoing ICI therapy. Subgroup analysis revealed a significant interaction between SAT density and PD-L1 expression, suggesting a link between patients’ metabolic status and tumour immune response [28]. The association between SAT radiodensity and PD-L1 expression may be indicative of a biological interaction where the qualitative state of adipose tissue affects immune regulation. Pro-inflammatory factors secreted by subcutaneous fat – including IL-6, TNF-α, and leptin – are capable of guiding immune cell migration, activating PD-L1 pathways, and reshaping tumour immunogenic responses [29]. Higher radiodensity measurements might correspond to fibrotic remodelling or inflammatory infiltration of adipose tissue, with possible downstream effects on immune checkpoint signalling and cytokine distribution. Recent experimental evidence supports this link, showing that cellular energy status can directly regulate PD-L1 protein abundance and shape antitumor immunity, thereby modulating the efficacy of checkpoint blockade therapy [30]. These hypotheses warrant further experimental validation.
This study has several limitations. The relatively small sample size and single-centre, retrospective design may limit generalizability and increase the risk of selection bias and residual confounding. Subcutaneous adipose tissue radiodensity was assessed only at baseline; dynamic changes during treatment were not captured. We did not account for other metabolic parameters such as sarcopenia, systemic inflammation, or nutritional status. The use of quartile-based categorization, although predefined, may have masked continuous or threshold effects and contributed to the modest, inconsistent non-linear trend seen in spline modelling. The strong statistical signal observed for the PD-L1 × SAT interaction should also be interpreted with caution, given the small subgroup sizes, multiple comparisons, and potential overfitting. Moreover, the survival benefit observed in Q2 may be partly influenced by the higher proportion of patients with PD-L1 ≥ 50% in that quartile. Internal validation via bootstrapping confirmed the robustness of the main finding, but external validation in larger, independent cohorts remains essential.
We also recognize the limitation of not including radiologic response as a study endpoint. Overall survival was intentionally selected due to its objective nature and relevance in real-world retrospective settings, where standardized imaging assessment is often lacking. Nonetheless, future prospective studies should explore radiologic response alongside overall survival and consider SAT radiodensity dynamics over time.
Based on our findings, radiologic assessment of SAT radiodensity may serve as a valuable component of multifactorial risk stratification in NSCLC. Future prospective studies with larger sample sizes, functional metabolic assessments, and integration of molecular markers are necessary to further elucidate the clinical utility of SAT density. If validated, SAT density could be incorporated into personalized immunotherapy selection algorithms.
Conclusions
This study demonstrates that SAT radiodensity, as measured by CT, may have prognostic significance for overall survival in patients with metastatic NSCLC undergoing ICI therapy. Specifically, we identified a U-shaped association between SAT radiodensity and mortality risk, with the lowest risk observed in patients with moderate SAT density (Q2). These results highlight the potential biological relevance of SAT as an indicator of metabolic balance in cancer patients and support the integration of SAT density into risk stratification models for predicting ICI treatment outcomes. Further prospective validation is needed to confirm these findings and define optimal SAT density thresholds for clinical use.