


Introduction
Pancreatic cancer is one of the greatest challenges of modern oncology [1, 2]. Due to the absence of characteristic symptoms, aggressive course, multifactorial aetiology, and lack of prophylactic screening tests, most patients (70–80%) present at an advanced stage of neoplastic disease [3, 4]. In those cases, treatment is aimed at improving the quality and length of life. The choice of an appropriate method takes into account the balance of benefits and risks entailed by a given procedure [5, 6]. From 10% to 25% of patients with unresectable pancreatic cancer develop symptoms and signs of gastrointestinal obstruction [7, 8]. Hence, gastrojejunostomy is performed in that group of patients using omega or Roux-en-Y methods. If less invasive endoscopic mechanical jaundice treatment proves ineffective, biliary bypass is additionally carried out [9, 10]. Although the aims of bariatric and palliative surgery in pancreatic cancer are different, there is surgical and technical similarity between the procedures. Bariatric surgery leads not only to significant body weight reduction, but also alleviates or even cures complications of obesity, including diabetes [11, 12]. Spectacular results are enabled through pleiotropic effects on, among others, the endocrine system, mainly the secretion of incretin hormones, neuronal stimulation, bile acid metabolism, lipid regulation, and microbiome changes [13–15]. The group of patients suffering from pancreatic cancer seems to be suitable for evaluating changes occurring in carbohydrate metabolism after gastrojejunostomy performed in patients with normal body mass index (BMI) and pancreatic cancer.
About 85% of patients with pancreatic cancer show impaired glucose tolerance or type 2 diabetes at the time of diagnosis, with co-occurrence of the two diseases being complex and multifactorial [16–19]. Observations indicate that long-term type 2 diabetes is one of the risk factors for pancreatic cancer development [20]. At the same time, when newly diagnosed, it may be its first symptom [21, 22]. The relationship between pancreatic cancer and diabetes requires analysis of the results of not only oncological and diabetic, but also genetic, metabolic, and endocrine tests [23]. Associations between diabetes and pancreatic cancer are highly complex, with significant co-occurrence of the disease entities in a substantial percentage of patients.
Aim
The aim of the study was to evaluate changes in glucose and insulin concentrations and insulin resistance indices following palliative gastrojejunostomy in patients with unresectable pancreatic head cancer and normal BMI.
Material and methods
The aim of the study was to analyse the effect of palliative gastrojejunostomy on carbohydrate metabolism in patients with unresectable pancreatic head tumour and normal BMI. In patients in the study and control groups, changes in venous blood plasma insulin and glucose concentrations were assessed and insulin resistance measures were analysed. The study enrolled patients hospitalised at the Department of General and Transplant Surgery of the Medical University of Lodz due to unresectable pancreatic head cancer (adenocarcinoma), who underwent palliative gastrojejunostomy. The procedure was performed using the Roux-en-Y method in 23 and the omega method in 11 patients. Decisions on the type of anastomosis were individually made by operators depending on their clinical experience. Due to the infiltration or pressure on the common bile duct by pancreatic tumour, biliary bypass was additionally performed (triple bypass) in 9 individuals. The control group consisted of patients hospitalised for unresectable pancreatic head cancer (adenocarcinoma), who underwent exploratory laparotomy without palliative gastrojejunostomy. Both in the study group and the control group, unresectability was determined based on local pancreatic tumour advancement; no remote metastases were found in the patients. The study enrolled individuals aged 47–75 years (mean: 62 years). The interval between the neoplastic tumour diagnosis and operation ranged from 2 to 8 weeks (mean: 4 weeks). Twenty-eight out of 54 patients were diagnosed with type 2 diabetes at the time of inclusion in the study. During observation, medical treatment of diabetes was not modified except for the perioperative period (the procedure day and 2–3 days thereafter), when intensive insulin therapy was applied. In the perioperative period, all patients received parenteral nutrition until oral diet introduction on days 3–4 after the operation. Patients with BMI ranging from 17.5 kg/m2 to 24.99 kg/m2 (mean: 21.5 ±2.1 kg/m2) were included in the study. Follow-up covered 54 patients operated on in the years 2019–2021. The study group comprised 43 patients, including 24 women and 19 men. The control group consisted of 11 patients: 5 women and 6 men. Insulin and glucose concentrations were assessed four times: before the procedure (insulin-0, glucose-0), on the 1st and 3rd day (insulin-1, glucose-1, insulin-3, glucose-3), and 4 weeks after the procedure (insulin-4, glucose-4). The analysis of results considered HOMA-IR and QUICKI insulin resistance indices, calculated based on insulin and glucose concentrations.
Statistical analysis
Statistical analysis was conducted using Statistica 13.1 software. Pearson’s or Fisher’s c2 tests were applied to compare nominal values. Comparisons of linear data were made using the Mann-Whitney U test and Spearman’s correlation. Comparisons of nonparametric repeated measures applied Friedman’s ANOVA with post-hoc Dunn’s test (Bonferroni correction). All measured results were considered significant at the a level = 0.05. The study was approved by the Ethics Committee of the Medical University of Lodz in Poland.
Results
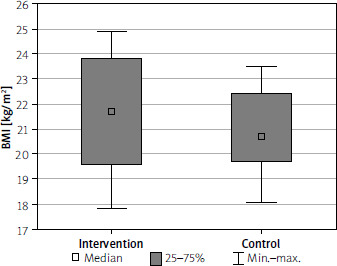
The mean BMI of all the analysed individuals was 21.6 ±2.2 kg/m2. Baseline BMIs did not statistically significantly differ between the control and study group, being 21.7 kg/m2 and 21.0 kg/m2, respectively. The groups were homogeneous in terms of their BMI class structures (Figure 1).
Figure 1
Distribution of the body mass index (BMI) values in both analysed groups (intervention, control). P = 0.288
Baseline glucose concentrations did not statistically significantly differ between the study and control group. The mean concentration was 140.2 ±49.9 mg/dl, with 139.4 ±50.9 mg/dl in the study group and 143.2 ±48.1 mg/dl in the control group.
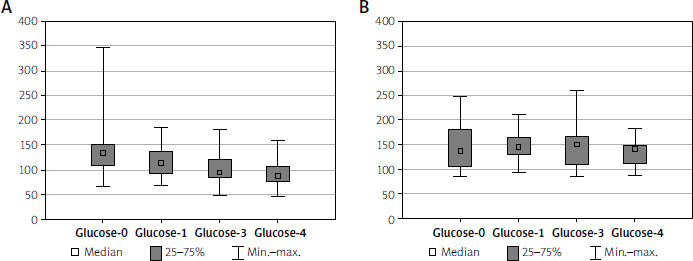
In the study group, decreases in both the mean glucose concentration, to 91.2 ±23.9 mg/dl (Table I), and the median (Table II) were observed. The changes were noticeable as early as on the 1st day after the procedure. Based on the conducted analysis, significant falls in glucose concentrations between consecutive measurements, rather than only compared to baseline concentrations, were noted (Figure 2). The observed differences were statistically significant at p < 0.05.
Table I
General characteristics of the study group
Table II
Detailed characteristics of the intervention and control groups
No significant changes were found in successive measurements in the control group. Mean venous blood glucose concentrations were 143.3 ±48.1 mg/dl and 133 ±25.3 mg/dl in the first and last measurement, respectively. No changes between successive results were observed in the control group. Mean glucose concentrations showed no significant differences during the study (Figure 2).
Figure 2
Glucose serum level comparisons in both analysed groups (A – Intervention, B – Control). There were no statistically significant differences between measurements in the control group (p = 0.921), whereas in the intervention group the differences between measurements 0 and 1, 3, and 4 as well as 1 and 3 and 4 were statistically significant (p < 0.001; post-hoc p: glucose-0 – glucose-1: p = 0.005; glucose-0 – glucose-3: p < 0.001; glucose-0 – glucose-4: p < 0.001; glucose-1 – glucose-3 p = 0.033; glucose-1 – glucose-4 p < 0.001; glucose-3 – glucose-4 p = 0.359)
The mean baseline insulin concentration did not statistically significantly differ between the study and control group, being 7.7 ±5.3 µU/ml; 7.5 ±5.3 µU/ml in the study group and 8.4 ±5.5 µU/ml in the control group.
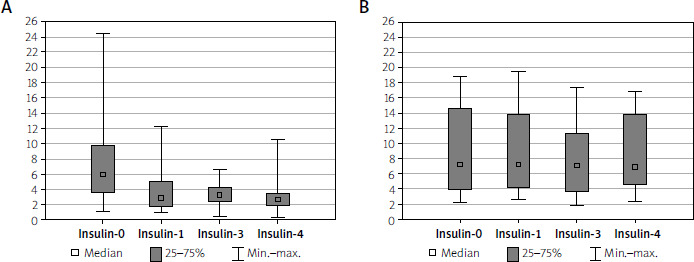
In the study group, a fall in the mean insulin concentration from 7.5 ±5.3 µU/ml to 3.1 ±2.3 µU/ml was observed after 4 weeks (Table I). The median also decreased (Table II).
Consecutive results were comparable and changes were statistically non-significant in the control group (Figure 3).
Figure 3
Insulin serum level comparisons in both analysed groups (A – Intervention, B – Control). There were no statistically significant differences between measurements in the control group (p = 0.409), whereas in the intervention group the differences between measurements 0 and 1, 3, and 4 were statistically significant (p < 0.001; post-hoc p: insulin-0 – insulin-1: p < 0.001; insulin-0 – insulin -3: p < 0.001; insulin-0 – insulin-4: p < 0.001; insulin-1 – insulin-3 p = 1.000; insulin-1 – insulin-4 p = 0.157; insulin-3 – insulin-4 p = 0.681)
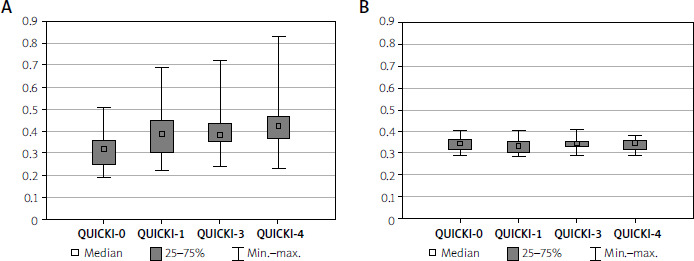
The mean baseline HOMA insulin resistance index was 2.6 ±1.9. Differences in the study and control group before the procedure were not statistically significant. The analysis showed a gradual decrease in the mean HOMA index values from 2.6 ±1.9 to 0.7 ±0.7 in the last measurement (Figure 4). When analysing the QUICKI index in the study group, a gradual increase in the received values in successive determinations was observed: from QUICKI-0 0.3 ±0.1 to QUICKI-4 0.4 ±0.1. No similar change was observed in the control group, where the received results remained comparable (Figure 5).
Figure 4
HOMA level comparisons in both analysed groups (A – Intervention, B – Control). There were no statistically significant differences between measurements in the control group (p = 0.591), whereas in the intervention group the differences between measurements 0 and 1, 3, and 4 as well as between 1 and 4 were statistically significant (p < 0.001; post-hoc p: HOMA-0 – HOMA-1: p < 0.001; HOMA-0 – HOMA-3: p < 0.001; HOMA-0 – HOMA-4: p < 0.001; HOMA-1 – HOMA-3 p = 0.681; HOMA-1 – HOMA-4 p = 0.048; HOMA-3 – HOMA-4 p = 1.000).
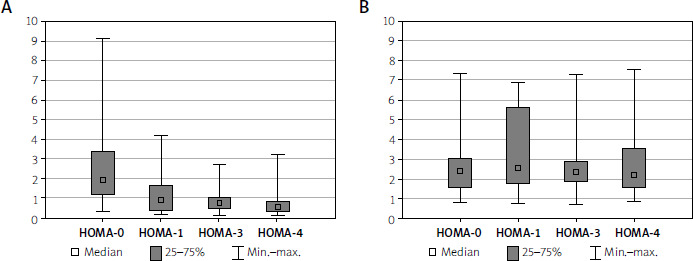
Figure 5
QUICKI level comparisons in both analysed groups (A – Intervention, B – Control). There were no statistically significant differences between measurements in the control group (p = 0.419), whereas in the intervention group the differences between measurements 0 and 1, 3, and 4 as well as between 1 and 4 were statistically significant (p < 0.001; post-hoc p: QUICKI-0 – QUICKI-1: p < 0.001; QUICKI-0 – QUICKI-3: p < 0.001; QUICKI-0 – QUICKI-4: p < 0.001; QUICKI-1 – QUICKI-3 p = 0.625; QUICKI-1 – QUICKI-4 p = 0.029; QUICKI-3 – QUICKI-4 p = 1.000)
Discussion
The subject of our study was to assess the impact of palliative gastrojejunostomy on glucose metabolism in patients with normal BMI and unresectable pancreatic head adenocarcinoma. The patient group seems optimal for evaluating changes occurring in carbohydrate metabolism due to commonly performed palliative gastroenterostomy, normal body weight or underweight (in most patients), and co-occurring diabetes [24, 25]. Although the purposes of metabolic surgery and palliative surgery for pancreatic cancer are different, there is a certain surgical similarity between the procedures [26, 27]. Surgical reorganisation of the gastrointestinal tract anatomy undoubtedly results in changes in nutrient absorption and metabolism, hence local stimulation and adaptation of short- and long-term hormonal, neuronal, and nutritional signals. The changes probably affect glycaemia and insulin resistance [28, 29]. The conducted analysis indicated that statistically significant changes occurred as early as on the first day after the procedure, and the effect not only persisted over the follow-up period, but it also deepened in successive determinations. The changes concerned glucose and insulin concentrations and, secondarily, also insulin resistance assessed with the HOMA-IR and QUICKI indices. Decreases in glucose and insulin concentrations were found on the first day after the procedure. Statistically significantly reduced concentrations were noticeable between successive results. Increasing differences between the compared groups was observed in consecutive measurements. Insulin and glucose concentrations did not change significantly in the control group over the study period. The changes also concerned insulin resistance: There was a statistically significant fall in insulin resistance expressed by a decrease in the HOMA-IR index and an increase in the QUICKI index in the intervention group.
Among possible mechanisms by which glucose concentration decreases occur after gastroenterostomy in patients with unresectable pancreatic cancer, changes in the secretion of incretin hormones, neuronal stimulation, gastrointestinal motility, bile acid metabolism, lipid regulation, and microbiome should be taken into consideration. Gastrojejunostomy causes changes in the gastroenteric tract hormonal regulation. An important role is played by incretin hormones affecting insulin secretion and glucose metabolism, e.g. glucagon-like peptide 1 (GLP-1) and glucose-dependent insulinotropic polypeptide (GIP) impact insulin secretion, glucose metabolism, hunger regulation, and stomach emptying. Concentrations of other incretin hormones, such as peptide YY (PYY), oxyntomodulin (OXM), and ghrelin, also change [30]. Gastrojejunostomy probably leads to increased GLP-1 secretion. GLP-1 is produced by small intestine cells in response to the presence of nutrients in the distal intestinal sections. Quicker passage of chyme to the distal part of the small intestine leads to increased hormone secretion, thereby contributing to reduced insulin resistance and improved glycaemic control. GLP-1 also slows down stomach emptying, prolonging the feeling of satiety after meals. GIP is produced in the duodenum and proximal jejunum. GIP concentrations may decrease after operations. Decreased GIP results from the fact that the duodenum and proximal jejunum are excluded from chyme passage. Those changes likely contribute to improved glycaemic control [31, 32]. PYY concentrations increase, causing reduced hunger and improved glycaemic control by slowing stomach emptying and reducing hyperglycaemia after meals [31]. OXM concentrations rise in response to quicker chyme passage to the distal small intestine, reducing insulin resistance. Decreased ghrelin concentrations are also observed, leading to reduced hunger [33]. Gastrointestinal motility after gastrojejunostomy also significantly changes in the context of both secretion of digestive enzymes and digestive mechanics. Stomach emptying is a process controlled by complex neurohormonal interactions. After operations, changes occur in stomach emptying, leading to significant metabolic and clinical consequences. Chyme bypasses the duodenum and goes directly to the small intestine, passing abruptly rather than being gradually released thereto. That affects the contact time between chyme and digestive enzymes, leading to impaired nutrient absorption. Changes in stomach emptying after gastrojejunostomy result from anatomical and hormonal alterations. They may lead to impaired absorption and reduced glucose concentration, but also an increased feeling of satiety and reduced calorie intake. Intensified small intestine peristalsis after duodenum bypassing anastomosis results from anatomical and hormonal mechanisms [34]. The duodenum plays the role of intestinal passage regulator, impacting peristalsis after meals through such hormones as cholecystokinin (CCK) and somatostatin. After operations, the mechanisms are weakened, and peristalsis in the distal sections of the small intestine is accelerated. Increased secretion of intestinal hormones: GLP-1 increases chyme passage in the small intestine, particularly in the ileum. Motilin and its increased secretion stimulate peristalsis. Quicker chyme passage makes chyme stimulate mechanical and chemical receptors faster. Increased osmotic pressure in the intestinal lumen activates intestinal reflexes, intensifying motility. With time, compensatory small intestine mucosa hypertrophy occurs, and the number of enteroendocrine cells secreting GLP-1, PYY, and CCK increases, which additionally intensifies peristalsis [35]. Gastrojejunostomy leads to significant changes in the gastric and intestinal pH. After operations, the stomach pH may increase, resulting in impaired digestion and absorption. The duodenal role is reduced, which entails decreased pancreatic juice and bile secretion in that region. As a result, the duodenal pH may increase, which reduces digestive enzyme efficiency. Reduced activity of pancreatic enzymes, such as trypsin and lipase, impairs digestion and nutrient absorption. After operations, the small intestine pH may change due to limited contact between chyme, pancreatic enzymes, and bile [36]. The changes also alter enteric microbiota and provide favourable conditions for bacterial proliferation [37]. The mechanism by which glucose and insulin concentrations decrease after palliative gastrojejunostomy remains unclear. We can speculate that changes observed in carbohydrate metabolism are probably the result of the pleiotropic effect of gastroenterostomy on the intestinal physiology, endocrine system, neuronal stimulation, secretion of incretin hormones, bile acid metabolism, lipid regulation, and changes in enteric microbiota [38, 39]. Gastrojejunostomy probably leads to several metabolic and neurohormonal changes, affecting carbohydrate metabolism in patients with pancreatic cancer and normal BMI [40]. The results indicate reduced glucose and insulin concentrations in patients who underwent palliative operations in pancreatic cancer. The performed operation leads to decreased glucose and insulin concentrations and reduced insulin resistance. The results confirm the beneficial metabolic effect of palliative gastroenterostomy; no similar changes were observed in patients with a pancreatic cancer diagnosis and solely exploratory laparotomy carried out. Therefore, the received results exclude pancreatic cancer as the only cause of the observed changes in glucose and insulin concentrations.
Conclusions
Palliative gastroenterostomy performed in patients with unresectable pancreatic head tumour and normal body mass index (BMI) statistically significantly impacted reduced glucose concentrations, which resulted in statistically significantly reduced venous blood plasma insulin and glucose concentrations in the study group. The obtained postoperative results were significantly lower in the study group compared to the control group. Secondarily to the changes, statistically significantly lowered insulin resistance, expressed by decreased HOMA-IR and increased QUICKI values, was observed.